Dashboards & Analysis Builder
Drag-and-drop analytics with rich visualizations. Build and share dashboards in minutes, not days.
- 20 built-in chart types including bar, line, area, pie, scatter, and KPI cards
- Resizable, draggable grid layout with save and restore
- No-code analysis builder inspired by Mixpanel and Amplitude
20 Built-in Visualizations
Every chart queries your cubes through the semantic layer, not raw SQL. Click any chart type to see a live demo.
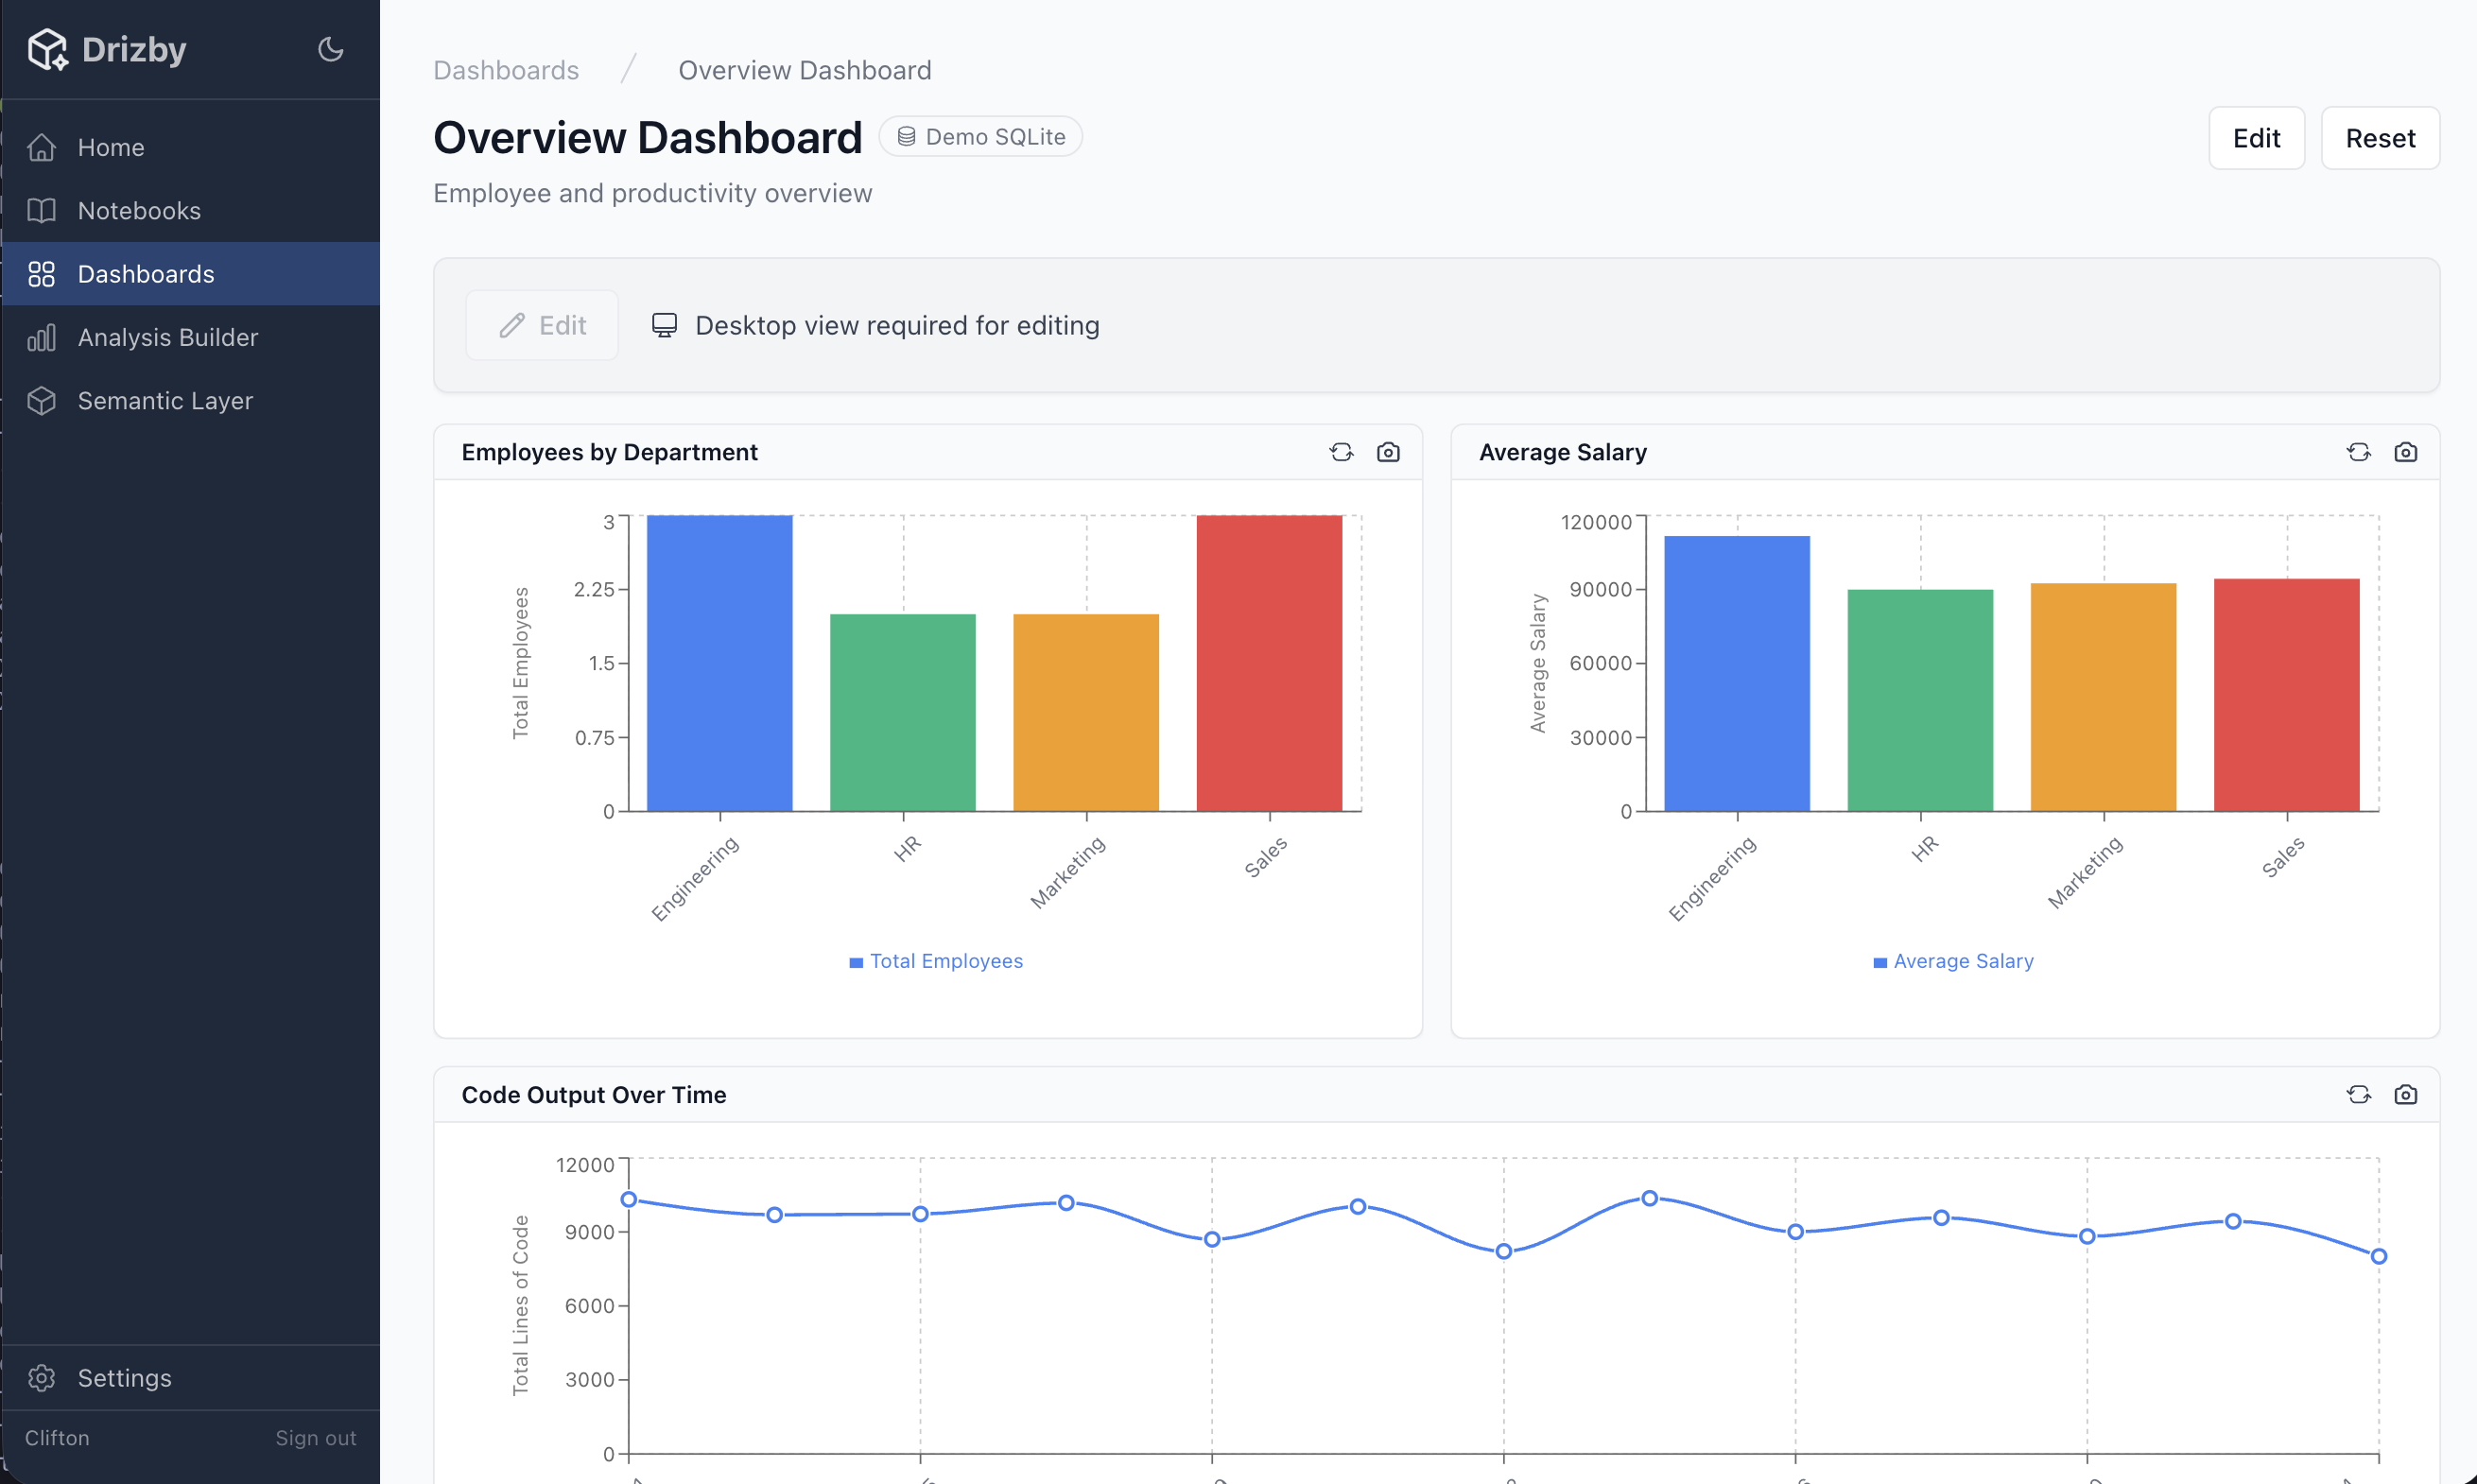
Grid Layout
Resizable, draggable portlets with react-grid-layout. Arrange your charts exactly how you want them. Save, load, and reset dashboard configurations with a single click.
Dashboard Features
Automatic thumbnail generation for quick previews. Per-dashboard filtering across all portlets. Group-based visibility controls. Promote notebook blocks into dashboards.
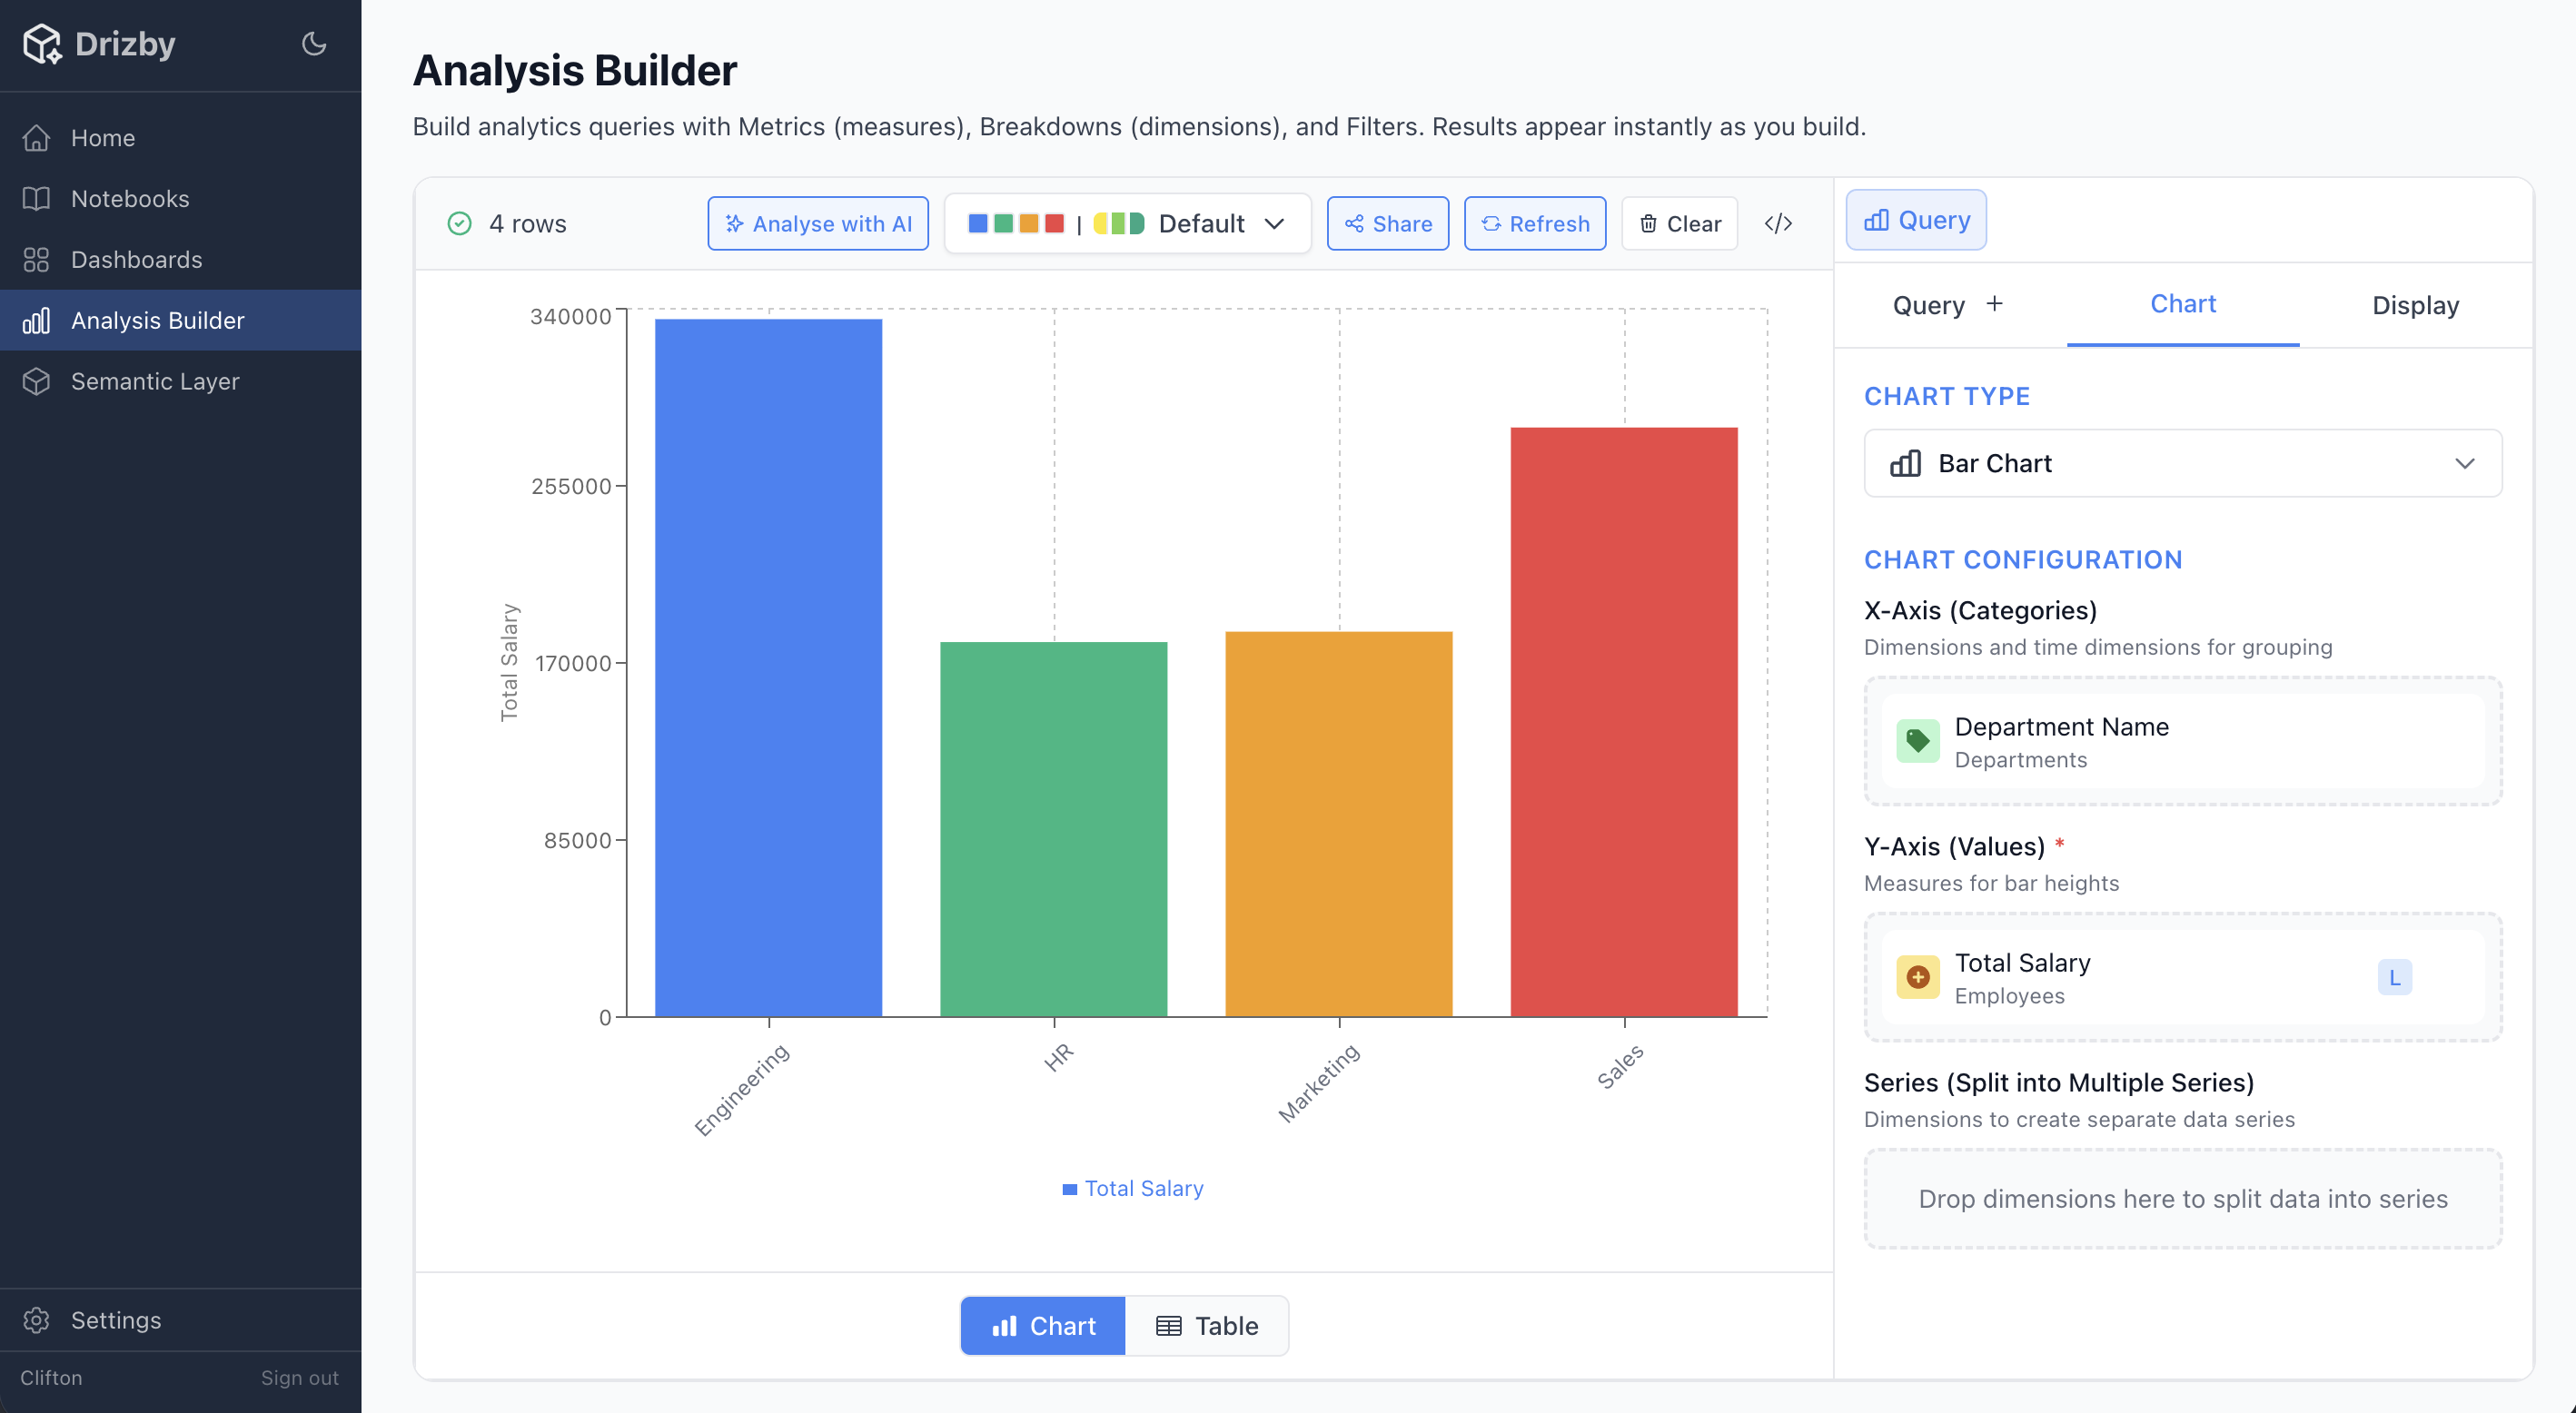
Analysis Builder
A visual, no-code query builder inspired by Mixpanel and Amplitude. Select measures and dimensions from your semantic layer, add filters, and see real-time results. No SQL required -- just point and click to explore your data.